|
Raspberry Pi based Digital Measurement System in Physics
|
||||||
|
||||||
|
|||
 |
|
|
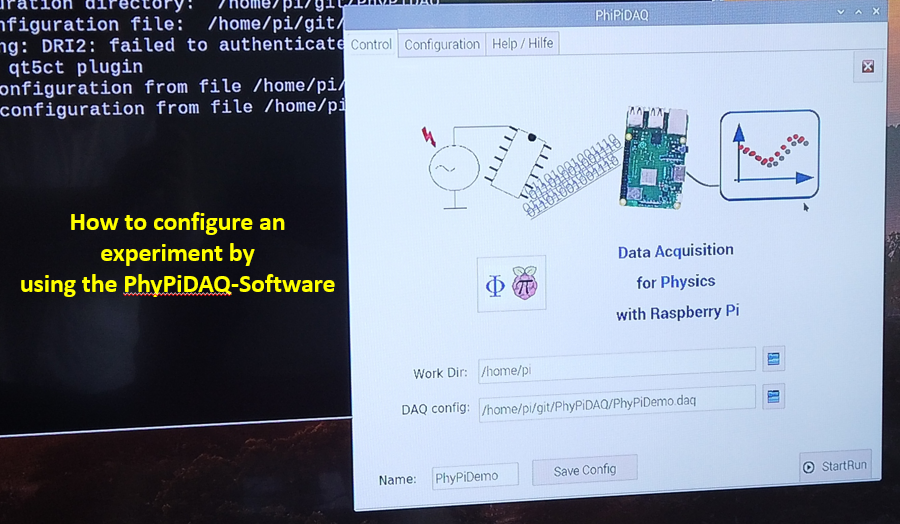
This video shows how to configure an experiment by using the PhyPiDAQ-Software. In this example the students configure an experiment to measure the position of a moving cart by connecting the distance sensor ToF VL53L0x to the Raspberry Pi via I2C-interface.
By pressing the PhyPi-Icon on the desktop window the Terminal and the graphical user interface open at the same time. On the GUI one can find the main configuration’s name of type .daq as well as the working directory where it is going to be saved afterward. To edit this configuration the students click the Configuration button on the menu bar at the top of the graphical user interface. The PhyPi Configuration Window with editable commands opens. Many of them are not active by default by the way of the #-Sign. In order to make any changes, one has to click first on Edit Mode. The next step is to deactivate the DeviceFile: ReplayConfig which appears in the default.daq configuration.
From the list of measuring devices and sensors, the students choose the device file of the sensor specific to their experiment by removing the #-Sign. After that, they click on the taskbar button to reload the device configuration. By pressing the Device Config button at the top of the menu bar one reaches the editable window of the sensor. In this example, the students configure a distance sensor. Depending on the acquired type of this sensor, one has to set the 0 or 1, followed by the setting of the measuring range of distance in their particular experiment.
After the sensors' configuration is done, they continue with the configuration of the channel limits ChanLimits by removing the #-Sign and introducing the desired measuring limits. These come up afterward in the measurements window. To calibrate especially analog sensors, such as the force-sensor, one can use the ChanCalib-command. Next, the students introduce the title, physical quantities, and units, which appear as well in the measuring window, and choose to save the measurements in .csv-file. The signals acquired via sensors are displayed in real-time by choosing different representations like the graph of one or more measured quantities over time with the help of the DisplayModule: DataLogger, instant bar charts with the DisplayModule: DataGraphs, or graphical dependencies of physical quantities with XYmode. In this example, the position of the cart is shown with the help of the DisplayModule: DataLogger. After all the commands are activated and the inputs are given the students save the main configuration of their experiment under the desired name. At the top of the graphical interface, they also choose the convenient directory where the configuration of type .daq is going to be saved. To run the measurement the students press the Control button on the top menu bar to come back to the main window of the graphical interface and click StartRun button to start the measurements. The measurement window with taskbar buttons to control the experimental sequences comes up. Now one can visualize the measurements in real time.
|