Raspberry Pi based Digital Measurement System in Physics
|
||||||
|
||||||
|
|||
|
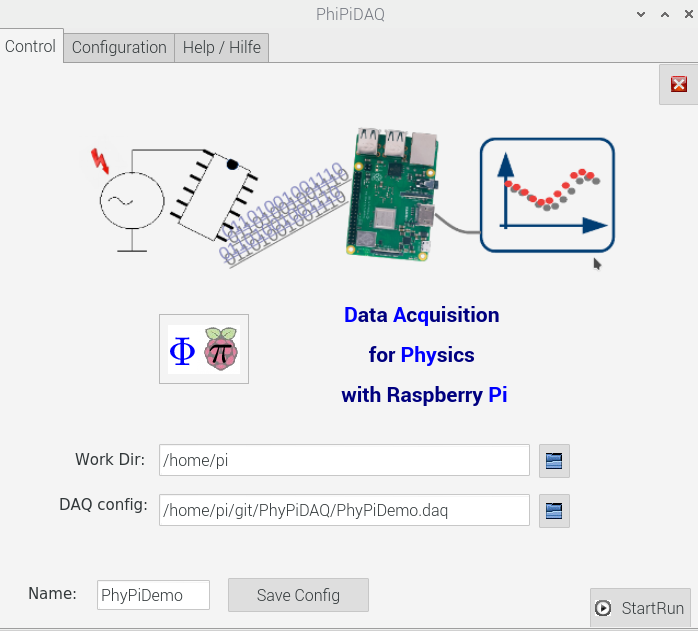
Fig. 1 The editable graphical interface of the PhyPiDAQ-Software |
The Open-Source Software Package PhyPiDAQ developed by the Prof. Günter Quast at the Karlsruhe Institute of Technology in Karlsruhe, Germany, consists of programmed classes in Python which, together with the Raspberry Pi, manage the collection, display, and storage of data obtained from physical sensors. In a single unified editable interface created with the program phypi.py each measurement device and sensor is addressed throughout some dedicated classes containing the same methods init(<config_dictionary>), acquireData(buffer) and closeDevice(). Each supported device and sensor needs a specific configuration of type .yaml, which is read from configuration files in sub-directory ./config. The main configuration file default.daq can be examined here. In this editable configuration the students deactivate the DeviceFile: config/ReplayConfig.yaml by using the #-Sign and activate the DeviceFile of the sensor they need to run their experiment by removing the #-Sign. In the selected device configuration of type .yaml of each sensor, the students can control the device outputs by introducing the active channels and their ranges to customize their experiment. To do that, they have a list with all the available commands, however, most of the commands are not active by default by way of the prefix “#”. To activate any command they have to remove first the “#”-sign. Once students have successfully introduced their sensor parameters in the device configuration of type .yaml, they start to configure the measuring channels of the sensors in the main configuration file of type .daq. by activating the commands for channel limits, labels, units, calibration of analog sensors or by introducing formulae to convert the measuring value into another desired physical quantity. Further built-in commands and instructions allow the user to pick different display modes, like the graph of measured quantities over time, instant bar charts of measured signals to quickly compare data and to highlight specific values at a glance, or XY-graphical relationship of physical quantities if using multiple sensors at the same time. Moreover, the PhyPiDAQ-Software gives the possibility to store the measured data. These are converted to a format compatible with spreadsheets such as the LibreOffice running directly on the Raspberry Pi for more extensive analysis. For more information regarding the structure, features and functions of the PhyPiDAQ-Software please visit the author's website. https://phypidaq.github.io, DOI 10.5281/zenodo.6355853 |

